Showing posts with label Oracle. Show all posts

Friday, 13 November 2015

Column Vs Row Data Storage

 Overview of Row Data Storage and Column Data Storage

Relational databases typically use row-based data storage. However Column-based storage is more suitable for many business applications. SAP HANA supports both row-based and column-based storage, and is particularly optimized for column-based storage.

As shown in the figure below, a database table is conceptually a two-dimensional structure composed of cells arranged in rows and columns.

Because computer memory is structured linearly, there are two options for the sequences of cell values stored in contiguous memory locations:

Row Storage - It stores table records in a sequence of rows.
Column Storage - It stores table records in a sequence of columns i.e. the entries of a column is stored in contiguous memory locations.

Traditional databases store data simply in rows. The HANA in-memory database stores data in both rows and columns. It is this combination of both storage approaches that produces the speed, flexibility and performance of the HANA database.

Advantages of column-based tables:

Faster Data Access:
Only affected columns have to be read during the selection process of a query. Any of the columns can serve as an index.

Better Compression:
Columnar data storage allows highly efficient compression because the majority of the columns contain only few distinct values (compared to number of rows).

Better parallel Processing:
In a column store, data is already vertically partitioned. This means that operations on different columns can easily be processed in parallel. If multiple columns need to be searched or aggregated, each of these operations can be assigned to a different processor core

Advantages and disadvantages of row-based tables:

Row based tables have advantages in the following circumstances:
  • The application needs to only process a single record at one time (many selects and/or updates of single records).
  • The application typically needs to access a complete record (or row).
  • Neither aggregations nor fast searching are required.
  • The table has a small number of rows (e. g. configuration tables, system tables).

Row based tables have dis-advantages in the following circumstances:
  • In case of analytic applications where aggregation are used and fast search and processing is required. In row based tables all data in a row has to be read even though the requirement may be to access data from a few columns.

Which type of tables should be preferred - Row-based or Column-based?

In case of analytic applications where aggregations are used and fast search and processing is required row-based storage are not good. In row based tables all data in a row has to be read even though the requirement may be to access data from a few columns. Hence these queries on huge amounts of data take a lot of time.

In columnar tables, this information is stored physically next to each other, significantly increasing the speed of certain data queries.

The following example shows the different usage of column and row storage, and positions them relative to row and column queries. Column storage is most useful for OLAP queries (queries using any SQL aggregate functions) because these queries get just a few attributes from every data entry. But for traditional OLTP queries (queries not using any SQL aggregate functions), it is more advantageous to store all attributes side-by-side in row tables. HANA combines the benefits of both row- and column-storage tables.

Conclusion:
To enable fast on-the-fly aggregations, ad-hoc reporting, and to benefit from compression mechanisms it is recommended that transaction data is stored in a column-based table.

The SAP HANA data-base allows joining row-based tables with column-based tables. However, it is more efficient to join tables that are located in the same row or column store. For example, master data that is frequently joined with transaction data should also be stored in column-based tables. 

Column Oriented Database Technologies

My recent blog (Big Data & NoSQL Technologies) discussed various NoSQL technologies and market vendors.  Today let’s dive into column-oriented databases and why they should play an important role in any data warehouse whose focus is on aggregations or metrics (and whose isn’t?).
So you are all probably familiar with row-oriented databases.  Tables of data where rows of fields (also called columns) represent the structural storage and the corresponding SQL queries that select, insert, update, and delete that data.  Most database vendors like Oracle, Microsoft, Sybase, Informix, and many others all base their technology on this ANSI standard.  Column-oriented databases are indeed what you might surmise; tables of data where columns of data values represent the structural storage.  What you might not expect is that on the surface many column-oriented databases look and feel like row oriented databases also using SQL queries in much the same way.  Creating tables, storing data, querying them are all pretty much identical.  They may appear similar, but two principal things to understand is that the significant differences under the hood, in particular, physical storage and query optimization.
As noted in my previous blogs on NoSQL, there is also a column-store technology out there.  Let’s not confuse that with column oriented databases.  They are different.  Since several NoSQL column-store vendors were highlighted before, we will focus instead on the column oriented database vendors here.
First, some key benefits to column oriented databases:

  • High performance on aggregation queries (like COUNT, SUM, AVG, MIN, MAX)
  • Highly efficient data compression and/or partitioning
  • True scalability and fast data loading for Big Data
  • Accessible by many 3rd party BI analytic tools
  • Fairly simple systems administration
Due to their aggregation capabilities which compute large numbers of similar data items, column oriented databases offer key advantages for certain types of systems, including:
  • Data Warehouses and Business Intelligence
  • Customer Relationship Management (CRM)
  • Library Card Catalogs
  • Ad hoc query systems
Column oriented database technology has actually been around for many years originating in 1969 with an application called TAXIR which provided abstracts for mathematical biosciences.  In 1976, Canada implemented the RAPID system for processing and retrieval of population and housing census statistics.  Sybase IQ was the only commercially available column-oriented database for many years, yet that has changed rapidly in the last few years.  Let’s take a quick look at some of today’s key players:
SAP Sybase IQ  (www.sybase.com)
A highly optimized analytics server designed specifically to deliver superior performance for mission-critical business intelligence, analytics and data warehousing solutions on any standard hardware and operating system.  Its column oriented grid-based architecture, patented data compression, and advanced query optimizer delivers high performance, flexibility, and economy in challenging reporting and analytics environments.
Essentially a data partitioned, index based storage technology, Sybase IQ’s engine offers several key features which include:
    • Web enabled analytics
    • Communications & Security
    • Fast Data Loading
    • Query Engine supporting Full Text Search
    • Column Indexing Sub System
    • Column Storage Processor
    • User Friendly CUI based Administration & Monitoring
    • Multiplex Grid Architecture
    • Information Live-cycle management
The Sybase IQ Very Large Data Base (VLDB) option provides partitioning and placement where a table can have a specified column partition key with value ranges.  This partition allows data that should be grouped together to be grouped together and separates data where they should be separated.  The drawback to this methodology is that it is not always known which is which.
Infobright  (www.infobright.com)
Offering both a commercial (IEE) and a free community (ICE) edition, the combination of a column oriented database with their Knowledge Grid architecture delivers a self-managed, scalable, high performance analytics query platform.  Allowing 50Tb using a single server, their industry-leading data compression (10:1 up to 40:1) significantly reduces storage requirements and expensive hardware infrastructures.  Delivered as a MySQL engine, Infobright runs on multiple operating systems and processors needing only a minimum of 4Gb of RAM (however 16Gb is a recommended starting point).
Avoiding partition schemes, Infobright data is stored in data packs, each node containing pre-aggregated statistics about the data stored within them.  The Knowledge Grid above provides related metadata providing a high level view of the entire content of the database.  Indexes, projections, partitioning or aggregated tables are not needed as these metadata statistics are managed automatically.  The granular computing engine processes queries using the Knowledge Grid information to optimize query processing eliminating or significantly reducing the amount of data required for decompressing and access to answer a query.  Some queries may not need to access the data at all, finding instead the answer in the Knowledge Grid itself.
The Infobright Data Loader is highly efficient so data inserts are very fast.  This performance gain does come at a price so avoid updates unless absolutely necessary, design de-normalized tables, and don’t plan on any deletes.  New features to the data loader include a reject option which allows valid rows to commit while invalid rows are logged.  This is highly useful when loading millions of rows and only having a few rows with bad data.  Without this feature the entire data load would be rolled back.
Vertica (HP)  (www.vertica.com)
Recently acquired by Hewlett Packard, this platform was purpose built from the ground up to enable data values having high performance real-time analytics needs.  With extensive data loading, queries, columnar storage, MPP architecture, and data compression features, diverse communities can develop and scale with a seamless integration ecosystem.
Claiming elasticity, scale, performance, and simplicity the Vertica analytics platform uses transformation partitioning to specify which rows belong together and parallelism for speed.  Several key features include:
    • Columnar Storage & Execution
    • Real-Time Query & Loading
    • Scale-out MPP Architecture
    • Automatic High Availability
    • Aggressive Data Compression
    • Extensible In-Database Analytics Framework
    • In-Database Analytics Library
    • Database Designer & Administration Tools
    • Native BI & ETL support for MapReduce & Hadoop
The Vertica Optimizer is the brains of the analytics platform producing optimal query execution plans where several choices exist.  It does this through traditional considerations like disk I/O and further incorporates CPU, memory, network, concurrency, parallelism factors and the unique details of the columnar operator and runtime environment.
ParAccel  (www.paraccel.com)
Analytic-driven companies need a platform, not just a database where speed, agility, and complexity drive the data ecosystem.  The ParAccel Analytic Platform streamlines the delivery of complex business decisions through its high performance analytic database.  Designed for speed, its extensible framework supports on-demand integration and embedded functions.
The ParAccel Database (PADB) present four main components: the ‘Leader’ node, the ‘Compute’ node, the Parallel Communications Fabric, and an optional Storage Area Network (SAN).  The ‘Leader’ controls the execution of the ‘Compute’ nodes and all nodes communicate with each other via the ‘Fabric’ running on standard x86 Linux servers.  Each ‘Compute’ node is subdivided into a set of parallel processes called ‘slices’ that include a CPU  core, and thier allocation of memory, and local disk storage.  The ‘Communication Fabric’ provides a low-level MPP network protocol for increased performance.
Key PADB features include:
    • High Performance & Scalability
    • Columnar Orientation
    • Extensible Analytics
    • Query Compilation
    • High Availability
    • Solution Simplicity
ParAccel Integrated Analytics Library and Extensibility Framework incorporates advanced functions along with an API to add your own functions to help address complex business problems right in the core database enabling customers to focus upon their specific data complexities.
Microsoft SQL Server 2012  (www.microsoft.com)
Released this year, Microsoft has now embraced the columnar database idea. The latest SQL Server release 2012 includes xVelocity, a column-store index feature that stores data similar to a column-oriented DBMS.  While not a true column oriented database, this technique allows for the creation of a memory optimized index that groups and stores data for each column then and joins them together to complete the index.  For certain types of queries, like aggregations, the query processor can take advantage of the column-store index to significantly improve execution times.  Column store indexes can be used with partitioned tables providing a new way to think about how to design and process large datasets.
The column-store index can be very useful on large fact tables in a Star schema improving overall performance, however the cost model approach utilized may choose the column-store index for a table when a row based index would have been better.  Using the IGNORE_NONCLUSTERED_COLUMNSTORE_INDEX query hint will work around this if it occurs.  When data is stored with a column-store index, data can often be compressed more effectively over a row based index.  This is accomplished as typically there is more redundancy within a column than within a row.  Higher compression means less IO is required to retrieve data into memory which can significantly reduce response times.
There are several restrictions and limitation in using a column-store index.  For example, which data types are supported or not and that you can only create one column-store index on any table can be problematic.  Become familiar with what it can do and where best to use it.  Currently the column-store index is not supported on Microsoft Azure.
Column-oriented databases provide significant advantages over traditional row oriented system applied correctly; In particular for data warehouse and business intelligence environments where aggregations prevail.  It would not be fair however to ignore the disadvantages.  Let’s look at these two:
  • Column-Oriented Advantages
    • Efficient storage and data compression
    • Fast data loads
    • Fast aggregation queries
    • Simplified administration & configuration
  • ‘Column-Oriented Disadvantages
    • Transactions are to be avoided or just not supported
    • Queries with table joins can reduce high performance
    • Record updates and deletes reduce storage efficiency
    • Effective partitioning/indexing schemes can be difficult to design
The real value in using column-oriented database technology comes from high performance, scalable storage and retrieval of large to massive datasets (Big Data) focused on aggregation queries.  Simply put: Reports!  You can design Star schema’s or Data Vaults (The Data Vault – What is it? – Why do we need it?) incorporating these technologies and you will find that column-oriented databases provide a clear solution in data warehouse and business intelligence.
Look for future blogs on Hadoop/Hive/HBase and Extract-Transform-Load (ETL) technologies, and don’t be afraid to comment, question, or debate, there is always room to learn new things…

Monday, 21 September 2015

Different ways to Manage Cache in OBIEE ( part 2)

You can also purge cache direct from Dashboard by following the given steps.
Goto  Settings—>Administration —> Issue sql
call sapurgeallcache() and click issues sql..below is the screen shot

PRESENTATION CACHEBy default, the cache files for the presentation server reside in the \tmp directory within the respective subdirectories sawcharts, sawrptcache and sawvc; while the xml cache files lying in the \tmp folder itself.  

Chart Cache - \OracleBIData\tmp\sawcharts\
Report Cache - \OracleBIData\tmp\sawrptcache\
State Pool Cache - \OracleBIData\tmp\sawvc\
XML Cache - \OracleBIData\tmp\
See image below for an example of how to modify the instance config to explicitly change the default presentation cache directory locations.


Additionally, and only specific to the XML Cache directory location change, you must also make a change to the nqconfig file as follows:

WORK_DIRECTORY_PATHS = "C:\DataSources\Cache\tmp";

ENABLE PRESENTATION CACHE
In instanceconfig.xml file ( \OracleBIData\web\config\instanceconfig.xml )

<ServerInstance>
<Cache>
<Query>
<MaxEntries>100</MaxEntries>
<MaxExpireMinutes>60</MaxExpireMinutes>
<MinExpireMinutes>10</MinExpireMinutes>
<MinUserExpireMinutes>10</MinUserExpireMinutes>
</Query>
</Cache>
<ServerInstance>


DISABLE PRESENTATION CACHE FOR ENTIRE APPLICATION
In instanceconfig.xml file ( \OracleBIData\web\config\instanceconfig.xml )
<ServerInstance>
<ForceRefresh>TRUE</ForceRefresh>
</ServerInstance>

BYPASS PRESENTATION CACHE
Sometimes you want to bypass the presentation / cache for development purposes. Or more often when you get weird write back behaviour. Add this to the instanceconfig file:

<CacheMaxExpireMinutes>-1</CacheMaxExpireMinutes>
<CacheMinExpireMinutes>-1</CacheMinExpireMinutes>
<CacheMinUserExpireMinutes>-1</CacheMinUserExpireMinutes>
CLEAR PRESENTATION CACHE
Via Oracle BI Web Application
Settings-->Administration-->Reload Files and Metadata-->Finished

or

Via Server Service
Shut down Presentation Services to remove the files for the Presentation Cache

**If you delete cache files when Presentation Services are still running or SAW does not shut down cleanly, then various cache files might be left on disk.


BI SERVER CACHE
By default, the BI Server Cache is stored in the \OracleBIData\cache\ directory and stored as NQS*.tbl files.

BI SERVER CACHE FILE NAME FORMAT 
image

NQS(Prefix)_VMVGGOBI(Originating Server Name)_733547(Days passed since 1-1-0000)40458(Seconds passed since last midnight)_00000006(Incremental number since last BI server start).TBL


ENABLE BI SERVER CACHE
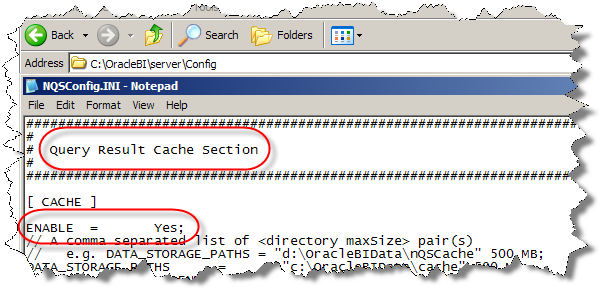
To enable the query cache for the entire application, you must set the ENABLE cache parameter value to YES in the file nqsconfig.  ( \OracleBI\server\Config\NQSConfig.INI )
ENABLE = YES;


DISABLE BI SERVER CACHE FOR ENTIRE APPLICATION
To disable the query cache for the entire application, you must set the ENABLE cache parameter value to NO in the file nqsconfig.  ( \OracleBI\server\Config\NQSConfig.INI )
ENABLE = NO;


BYPASS BI SERVER CACHE FOR SINGLE REPORT
In Answers, goto Advanced Reporting tab when building report, set Prefix value to following:
SET VARIABLE DISABLE_CACHE_HIT=1, DISABLE_CACHE_SEED=1, LOGLEVEL=7;


CLEAR BI SERVER CACHE
To clear the BI Server Cache files, run the following command file:  \OracleBI\server\cache_purge_reseed\call.bat 

This calls the purge.txt file, which simply contains the following command:
call SAPurgeAllCache();

This will clear the BI Server Cache (.TBL) files in the Cache directory:
\OracleBIData\cache\

or

An alternate way of doing this is via the OBI Admin Tool, using the Cache management feature.


BI SERVER CACHE PERSISTENCE
...When a dynamic repository variable is updated, cache is automatically purged. This is designed behavior. Cache will be invalidated (i.e. purged) whenever the initialization block that populates dynamic repository variable is refreshed. The reason that refreshing a variable purges cache is that if a variable was used in a calculation, and the variable changed, then cache would have invalid data. By purging cache when a variable changes, this problem is eliminated.

Since this is the designed functionality, Change Request 12-EOHPZ3 titled ‘Repository variable refresh purges cache’ exists on our database to address a product enhancement request. The workaround is to go through the dynamic repository variables and verify that the variables are being refreshed at the correct interval. If a variable needs to be refreshed daily, there may be a need to set up a cache seeding .bat file that runs after the dynamic variable has been updated. If the cache seeding .bat file runs prior to the refresh of the dynamic variable refresh, then the cache will be lost.

BI SERVER CACHE ENABLED BUT NOT CACHING
OBIEE cache is enabled, but why is the query not cached?...

Non-cacheable SQL function:  If a request contains certain SQL functions, OBIEE will not cache the query. The functions are CURRENT_TIMESTAMP, CURRENT_DATE, CURRENT_TIME, RAND, POPULATE. OBIEE will also not cache queries that contain parameter markers.

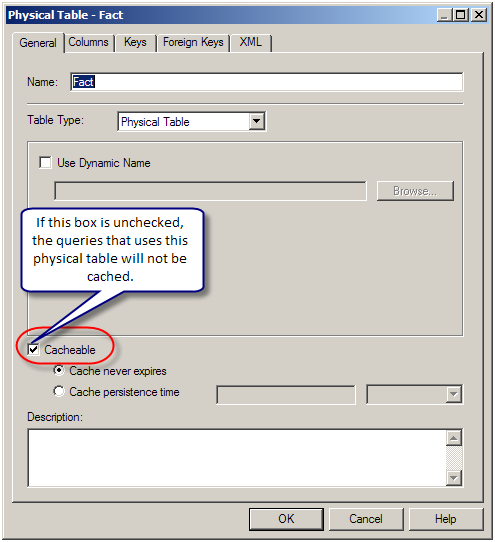
Non-cacheable Table:  Physical tables in the OBIEE repository can be marked ‘non-cacheable’. If a query makes a reference to a table that has been marked as non-cacheable, then the results are not cached even if all other tables are marked as cacheable.


Query got a cache hit: In general, if the query gets a cache hit on a previously cached query, then the results of the current query are not added to the cache. Note: The only exception is the query hits that are aggregate “roll-up” hits, will be added to the cache if the nqsconfig.ini parameter POPULATE_AGGREGATE_ROLLUP_HITS has been set to Yes.

Caching is not configured: Caching is not enabled in NQSConfig.ini file.


Result set too big: The query result set may have too many rows, or may consume too many bytes. The row-count limitation is controlled by the MAX_ROWS_PER_CACHE_ENTRY nqsconfig.ini parameter. The default is 100,000 rows. The query result set max-bytes is controlled by the MAX_CACHE_ENTRY_SIZE nqsconfig.ini parameter. The default value is 1 MB. Note: the 1MB default is fairly small. Data typically becomes “bigger” when it enters OBIEE. This is primarily due to Unicode expansion of strings (a 2x or 4x multiplier). In addition to Unicode expansion, rows also get wider due to : (1) column alignment (typically double-word alignment), (2) nullable column representation, and (3) pad bytes.


Bad cache configuration: This should be rare, but if the MAX_CACHE_ENTRY_SIZE parameter is bigger than the DATA_STORAGE_PATHS specified capacity, then nothing can possibly be added to the cache.

Query execution is cancelled: If the query is cancelled from the presentation server or if a timeout has occurred, cache is not created.

OBIEE Server is clustered: Only the queries that fall under “Cache Seeding” family are propagated throughout the cluster. Other queries are stored locally. If a query is generated using OBIEE Server node 1, the cache is created on OBIEE Server node 1 and is not propagated to OBIEE Server node 2

Seeding / Filling the cache

  • Now why should you want to do that? OBIEE is not a database, so why would this be an advantage?
  • If you have a "slow” connection to your source database, maybe because it's on the other side of the world.
  • If you have "slow" aggregation views.
  • If you can "predict" what 90% percent of your queries look like .

From your user statistics you can pick up the top 10 of your queries, Check if you can make them "dynamic" by changing fixed date into dynamic dates.
Put the following in a .txt file in your maintenance directory.

// Load cache by Query
// John Minkjan CIBER Nederland
// FileName: LoadCache.txt
// executed by cmd string:
// nqcmd -d AnalyticsWeb -u Administrator -p Administrator -s c:\obiee\mscripts\LoadCache.txt
// Query 1
SELECT TBLFUELCONSUMPTION.LICENSEPLATE, TBLFUELCONSUMPTION.MEASUREDATE, TBLFUELCONSUMPTION.FUELCONSUMPTION FROM Trucks WHERE TBLFUELCONSUMPTION.MEASUREDATE >= TIMESTAMPADD(SQL_TSI_YEAR, -2,NOW());

// Query 2
SELECT TBLFUELCONSUMPTION.LICENSEPLATE, TBLFUELCONSUMPTION.MEASUREDATE, TBLFUELCONSUMPTION.FUELCONSUMPTION FROM
Trucks WHERE TBLFUELCONSUMPTION.MEASUREDATE <= TIMESTAMPADD(SQL_TSI_YEAR, -3,NOW());

// The Queries are separated with a ;

Different ways to Manage Cache in OBIEE ( Part 1 )

Different ways to Manage Cache in OBIEE!!

Emptying/Purging the cacheOne of the most powerful features of OBIEE is the way it uses it's cache. Good cache management can really boost your performance. From the system management point of view there are a couple of tips and tricks to influence the cache performance.
For a customer I made a couple of handy scripts for handling the cache.

1. Purging the whole cache.

If you have a completed database reload or want to do some performance testing with your repository you might want to purge the whole cache.
Put the following in a .txt file in your maintenance directory
// Purge complete cache
// John Minkjan Ciber Nederland
// executed by cmd string:
// nqcmd -d AnalyticsWeb -u Administrator -p Administrator -s

c:\obiee\mscripts\purgecompletecache.txt Call SAPurgeAllCache()

You can execute this from the commandline: nqcmd -d AnalyticsWeb -u Administrator -p Administrator -s c:\obiee\mscripts\purgecompletecache.txt

2. Purging the cache by table

If you have a major update of your dimensional tables you might want to clear the cache for just one table.
Put the following in a .txt file in your maintenance directory:

// Purge complete cache
// John Minkjan Ciber Nederland
// FileName: PurgeTableCache.txt
// executed by cmd string:
// nqcmd -d AnalyticsWeb -u Administrator -p Administrator -s
c:\obiee\mscripts\PurgeTableCache.txt

Call SAPurgeCacheByTable( 'JJMORCL_SH', NULL, 'SH', 'TBLTRUCKS' );

You can execute this from the commandline: nqcmd -d AnalyticsWeb -u Administrator -p Administrator -s c:\obiee\mscripts\PurgeTableCache.txt

WOW: the database, schema, (catalog), and tablename are the names in OBIEE not in the database.

3. Purging the cache by query

Sometimes you only want to purge only "old" data from your cache.
Put the following in a .txt. file in your maintenance directory:

// Purge cache by Query
// John Minkjan Ciber Nederland
// FileName: PurgeQueryCache.txt
// executed by cmd string:
// nqcmd -d AnalyticsWeb -u Administrator -p Administrator -s
c:\obiee\mscripts\PurgeQueryCache.txt

Call SAPurgeCacheByQuery('SELECT TBLFUELCONSUMPTION.LICENSEPLATE,
TBLFUELCONSUMPTION.MEASUREDATE, TBLFUELCONSUMPTION.FUELCONSUMPTION FROM Trucks
WHERE TBLFUELCONSUMPTION.MEASUREDATE <= TIMESTAMPADD(SQL_TSI_YEAR, -1,NOW())'); // The "query" line must be one contiues line! You can execute this from the commandline: nqcmd -d AnalyticsWeb -u Administrator -p Administrator -s c:\obiee\mscripts\PurgeQueryCache.txt


WOW: the "query" is the OBIEE one not the database one!

4 Purging the cache by database

Put the following in a .txt. file in your maintenance directory:
// Purge cache by Database
// John Minkjan Ciber Nederland
// FileName: PurgeDataBaseCache.txt
// executed by cmd string:
// nqcmd -d AnalyticsWeb -u Administrator -p Administrator -s
c:\obiee\mscripts\PurgeDataBaseCache.txt

Call SAPurgeCacheByDatabase( 'JJMORCL_SH' );

// The "dbName" is the OBIEE name!

You can execute this from the commandline: nqcmd -d AnalyticsWeb -u Administrator -p Administrator -s c:\obiee\mscripts\PurgeDataBaseCache.txt

Till Next Time

OBIEE 10G/11G - Logical Query Result Cache Parameters

OBIEE 10G/11G - Logical Query Result Cache Parameters

About

You can set the query cache application parameters:
  • for 10g in the file OBIEE - NQSConfig.ini.
  • For some parameters in 11g, with the help of FMW Control > Business Intelligence > CoreApplication > Capacity Management tab.

Articles Related

Example

[CACHE]

ENABLE = YES;
DATA_STORAGE_PATHS = "d:\OracleBI\cache" 256MB, "f:\OracleBI\cache" 200MB ;
MAX_ROWS_PER_CACHE_ENTRY = 100000;  // 0 is unlimited size
MAX_CACHE_ENTRY_SIZE = 1 MB;
MAX_CACHE_ENTRIES = 1000;
POPULATE_AGGREGATE_ROLLUP_HITS = NO;
USE_ADVANCED_HIT_DETECTION = NO;

MAX_SUBEXPR_SEARCH_DEPTH = 7;

// Cluster Cache Parameters
GLOBAL_CACHE_STORAGE_PATH = "<directory name>" SIZE;
MAX_GLOBAL_CACHE_ENTRIES = 1000;
CACHE_POLL_SECONDS = 300;
CLUSTER_AWARE_CACHE_LOGGING = NO;
The parameters in the Query Result Cache Section provide configuration information for Oracle Business Intelligence Server caching. The parameters that control query caching are described in this section.

Parameters

ENABLE

Specifies whether the cache system is enabled.
  • For 10g, modify the parameter in the file nqsconfig.ini. When set to NO, caching is disabled. When set to YES, caching is enabled.
  • For 11g, modify the parameter with FMW Control > Business Intelligence > CoreApplication > Capacity Management tab

DATA_STORAGE_PATHS

Specifies one or more directory paths for where the cached query results data is stored and are accessed when a cache hit occurs.
When the cache storage directories begin to fill up, the entries that are least recently used (LRU) are discarded to make space for new entries.
Rules :
  • The maximum capacity in bytes, kilobytes, megabytes or gigabytes. The maximum capacity for each path is 4 GB.
An Oracle Business Intelligence Server defined as a clustered server does not share cached data. The DATA_STORAGE_PATHS entry needs be unique for each server defined as a cluster participant>
  • Each directory listed needs to be an existing, fully-qualified, writable directory pathname, with double quotes ( ” ) surrounding the pathname.
  • Specify mapped directories only.
  • UNC path names and network mapped drives are allowed only if the service runs under a qualified user account.
  • Specify multiple directories with a comma separated list. When you specify more than one directory, they should reside on different physical drives. (If you have multiple cache directory paths that all resolve to the same physical disk, both available and used space may be double-counted.)
Syntax:
DATA_STORAGE_PATHS = "<full_directory_path_1>" sz[, "<full_directory_path_2>" sz{, "<full_directory_path_n>" sz}] ;
Specifying more than one directory per drive does not improve performance, because file input and output (I/O) takes place through the same I/O controller. In general, specify only one directory per disk drive. Specifying multiple directories on different drives may improve the overall I/O throughput of the Oracle Business Intelligence Server internally by distributing I/O across multiple devices.

MAX_ROWS_PER_CACHE_ENTRY

Specifies the maximum number of rows in a query result set to qualify for storage in the query cache. Limiting the number of rows is a useful way to avoid using up the cache space with runaway queries that return large numbers of rows.
If the number of rows a query returns is greater than the value specified in the MAX_ROWS_PER_CACHE_ENTRY parameter, the query is not cached.
When set to 0, there is no limit to the number of rows per cache entry.

MAX_CACHE_ENTRY_SIZE

Specifies the maximum size for a cache entry. Potential entries that exceed this size are not cached. The default size is 1 MB.
Specify GB for gigabytes, KB for kilobytes, MB for megabytes, and no units for bytes.
  • For 10g, modify the parameter in the file nqsconfig.ini.
  • For 11g, modify the parameter with FMW Control > Business Intelligence > CoreApplication > Capacity Management tab

MAX_CACHE_ENTRIES

Specifies the maximum number of cache entries allowed in the query cache. Limiting the total number of cache entries provides another parameter with which to manage your cache storage. The actual limit of cache entries might vary slightly depending on the number of concurrent queries. The default value is 1000.
  • For 10g, modify the parameter in the file nqsconfig.ini. When set to NO, caching is disabled. When set to YES, caching is enabled.
  • For 11g, modify the parameter with FMW Control > Business Intelligence > CoreApplication > Capacity Management tab

POPULATE_AGGREGATE_ROLLUP_HITS

A cache hit means that the server was able to use cache to answer the query and did not go to the database at all.
Normally, when a user ask for information that exist in the cache but at a lowest level, OBIEE server retrieve the cache hit, aggregate the measures but the result is not put into the cache.
Example :
  • A user ask for the sales by district, region
  • A cache is created
  • An other user ask for the sales by region
  • OBIEE server use the first entry to retrieve the information set for the second query. This is referred to as a rollup cache hit.
  • The result is returned to the user but not inserted in the cache.
Setting this parameter to TRUE may result in better performance, but results in more entries being added to the cache.

USE_ADVANCED_HIT_DETECTION

When caching is enabled, each query is evaluated to determine whether it qualifies for a cache hit. A cache hit means that the server was able to use cache to answer the query and did not go to the database at all.
The Oracle BI Server can use query cache to answer queries at the same or higher level of aggregation.

MAX_SUBEXPR_SEARCH_DEPTH

MAX_SUBEXPR_SEARCH_DEPTH = 7;

GLOBAL_CACHE_STORAGE_PATH

For the cluster-aware caching feature,

MAX_GLOBAL_CACHE_ENTRIES

For the cluster-aware caching feature, it controls the maximum number of entries that are allowed in the global cache store.

CACHE_POLL_SECONDS

For the cluster-aware caching feature, it specifies the interval in seconds at which the Oracle BI Server pulls from the logical event queue to synchronize with other server nodes in the cluster.

CLUSTER_AWARE_CACHE_LOGGING

For the cluster-aware caching feature, the CLUSTER_AWARE_CACHE_LOGGING parameter controls whether logging is turned on for the global cache. Change this setting to YES only for debugging purposes.
Log entries appear in nqquery.log.

DISABLE_SUBREQUEST_CACHING

On 11g, caching occurs by default at the subrequest level, which results in multiple cache entries for some SQL statements. Caching subrequests improves performance and the cache hit ratio, especially for queries that combine real-time and historical data. To disable subrequest caching, set DISABLE_SUBREQUEST_CACHING to YES.

Global cache path

FMW Control > Business Intelligence > CoreApplication > Capacity Management tab.

Global cache size

FMW Control > Business Intelligence > CoreApplication > Capacity Management tab.

Creating a Repository Using the Oracle Business Intelligence Administration Tool ( part 11 )

Lab 9: Creating Time Series Measures
In this topic you create time series calculation measures using Oracle BI time series functions.
Time series functions include AGO, TODATE, and PERIODROLLING. These functions let you use Expression Builder to call a logical function to perform time series calculations instead of creating aliases for physical tables and modeling logically. The time series functions calculate AGO, TODATE, and PERIODROLLING functions based on the calendar tables in your data warehouse, not on standard SQL date manipulation functions.
To create time series measures, you perform the following steps:
  • Identify a Logical Dimension as a Time Dimension
  • Identify Level Keys as Chronological Keys
  • Create a Measure Using the AGO Function
  • Create a Measure Using the TODATE Function
  • Create a Measure Using the PERIODROLLING Function
  • Test Your Work
Identify a Logical Dimension as a Time Dimension


1 .
Return to the Administration Tool and open the BISAMPLE repository in offline mode.
 
2 .
In the BMM layer, double-click the H1 Time logical dimension to open the Logical Dimension dialog box.
Screenshot for Step
3 .
In the Structure section, select Time.
Screenshot for Step
Time series functions operate on time-oriented dimensions. To use these functions on a particular dimension, you must designate the dimension as a Time dimension.

4 .
Click OK to close the Logical Dimension dialog box.

Identify Level Keys as Chronological Keys


1 .
Expand the H1 Time logical dimension and double-click the Time Detail level to open the Logical Level dialog box.
 
2 .
Click the Keys tab.
Screenshot for Step
3 .
Select the Chronological Key check box for Calendar Date.
Screenshot for Step

4 .
Click OK to close the Logical Level dialog box.

5 .
Repeat and set chronological keys for the following levels:
Logical Level
Chronological Key
Year
Per Name Year
Half
Per Name Half
Quarter
Per Name Qtr
Month
Per Name Month
Week
Per Name Week
It is best practice to designate a chronological key for every level of a time logical dimension.

Create a Measure Using the AGO Function


1 .
Right-click the F1 Revenue logical table and select New Object > Logical Column.
 
2 .
On the General tab, name the column Month Ago Revenue.
Screenshot for Step
3 .
On the Column Source tab, select "Derived from existing columns using an expression."
Screenshot for Step

4 .
Open the Expression Builder.

5 .
Select Functions > Time Series Functions > Ago.
Screenshot for Step

6 .
Click Insert selected item to add the Ago function to the Expression Builder.
Screenshot for Step

7 .
Click <<Measure>>in the expression.
Screenshot for Step

8 .
Select Logical Tables > F1 Revenue and then double-click Revenue to add it to the expression.
Screenshot for Step

9 .
Click <<Level>> in the expression.
Screenshot for Step

10 .
Select Time Dimensions > H1 Time and then double-click Month to add it to the expression.
Screenshot for Step

11 .
Click <<Number of Periods>> and enter 1. The Ago function will calculate the Revenue value one month before the current month.
Screenshot for Step

12 .
Click OK to close the Expression Builder. Check your work in the Logical Column dialog box:
Screenshot for Step

13 .
Click OK to close the Logical Column dialog box. The Month Ago Revenue time series measure is added to the F1 Revenue logical table.
Screenshot for Step

14 .
Drag the Month Ago Revenue logical column to the Base Facts presentation folder.
Screenshot for Step

Create a Measure Using the TODATE Function


1 .
Right-click the F1 Revenue logical table and select New Object > Logical Column.
 
2 .
On the General tab, name the new logical column Year To Date Revenue.
Screenshot for Step
3 .
On the Column Source tab, select "Derived from existing columns using an expression."
Screenshot for Step

4 .
Open the Expression Builder.

5 .
Select Functions > Time Series Functions and double-click ToDate to insert the expression.
Screenshot for Step

6 .
Click <<Measure>> in the expression.
Screenshot for Step

7 .
Select Logical Tables > F1 Revenue and then double-click Revenue to add it to the expression.
Screenshot for Step

8 .
Click <<Level>> in the expression.
Screenshot for Step

9 .
Select Time Dimensions > H1 Time and then double-click Year to add it to the expression.
Screenshot for Step

10 .
Click OK to close the Expression Builder.

11 .
Check your work in the Logical Column dialog box:
Screenshot for Step

12 .
Click OK to close the Logical Column dialog box.

13 .
Drag the Year To Date Revenue logical column to the Base Facts presentation folder.
Screenshot for Step

Create a Measure Using the PERIODROLLING Function


1 .
Right-click the F1 Revenue logical table and select New Object > Logical Column.
 
2 .
On the General tab, name the new logical column Revenue 3-Period Rolling Sum.
Screenshot for Step
3 .
On the Column Source tab, select "Derived from existing columns using an expression."
Screenshot for Step

4 .
Open the Expression Builder.

5 .
Select Functions > Time Series Functions and double-click PeriodRolling to insert the expression.
Screenshot for Step

6 .
Click <<Measure>> in the expression.
Screenshot for Step

7 .
Select Logical Tables > F1 Revenue and then double-click Revenue to add it to the expression.
Screenshot for Step

8 .
Click <<Starting Period Offset>> in the expression.
Screenshot for Step

9 .
Enter -2. This identifies the first period in the rolling aggregation.
Screenshot for Step

10 .
Click <<Ending Period Offset>>.
Screenshot for Step

11 .
Enter 0. This identifies the last period in the rolling aggregation.
Screenshot for Step
These integers are the relative number of periods from a displayed period. In this example, if the query grain is month, the 3 month rolling sum starts two months in the past (-2) and includes the current month (0).

12 .
Click OK to close the Expression Builder.

13 .
Check your work in the Logical Column dialog box:
Screenshot for Step

14 .
Click OK to close the Logical Column dialog box.

15 .
Drag the Revenue 3-Period Rolling Sum logical column to the Base Facts presentation folder.
Screenshot for Step

16 .
Save the repository and check consistency. Fix any errors or warnings before you proceed.

17 .
Close the repository. Leave the Administration Tool open.

Test Your Work


1 .
Return to Fusion Middleware Control Enterprise Manager and load the BISAMPLE repository. If you need help, click here to review steps from earlier in this tutorial.

2 .
Return to Oracle BI and sign in.

3 .
Create the following analysis to test AGO and TODATE functions:
Time.Per Name Month
Time.Per Name Year
Base Facts.Revenue
Base Facts.Month Ago Revenue
Base Facts.Year to Date Revenue
Screenshot for Step
 
4 .
Set the following filter for the analysis:
Per Name Year is equal to / is in 2008.
Screenshot for Step
5 .
For the Per Name Year column, select Column Properties > Column Format > Hide. This will prevent Per Name Year from displaying in the analysis results.
Screenshot for Step

6 .
Sort Per Name Month in ascending order.
Screenshot for Step

7 .
Click Results.
Screenshot for Step
Month Ago Revenue displays revenue from the previous month. Year To Date Revenue calculates a running sum of revenue for the year on a monthly basis.
 
8 .
Create the following new analysis and filter to test the PERIODROLLING function at the month grain:
Time.Per Name Month
Time.Per Name Year
Base Facts.Revenue
Base Facts.Revenue 3-Period Rolling Sum
Per Name Year is equal to / is in 2008
Screenshot for Step

Screenshot for Step

9 .
For the Per Name Year column, select Column Properties > Column Format > Hide. This will prevent Per Name Year from displaying in the analysis results.
Screenshot for Step

10 .
Sort Per Name Month in ascending order.
Screenshot for Step

11 .
Click Results.
Screenshot for Step
Revenue 3-Period Rolling Sum is calculated based on the month grain.
 
12 .
Create the following new analysis and filter to test the PERIODROLLING function at the year grain:
Time.Per Name Year
Base Facts.Revenue
Base Facts.Revenue 3-Period Rolling Sum
Screenshot for Step

13 .
Sort Per Name Year in ascending order.
Screenshot for Step

14 .
Click Results.
Screenshot for Step
Revenue 3-Period Rolling Sum is calculated based on the year grain. A measure with the PERIODROLLING function calculates results based on the query grain.
 
Summary
In this tutorial you learned how to build an Oracle BI metadata repository using the Oracle BI Administration Tool. You learned how to import metadata from a data source, simplify and reorganize the imported metadata into a business model, and then structure the business model for presentation to users who request business intelligence information via Oracle BI user interfaces.
In this tutorial, you have learned how to:
  • Build the three layers of a Oracle BI repository
  • Test and validate an Oracle BI repository
  • Manage logical table sources
  • Create simple measures and calculation measures
  • Create logical dimensions with level-based hierarchies
  • Create level-based measures
  • Create logical dimensions with parent-child hierarchies
  • Create logical dimensions with ragged and skipped-level hierarchies
  • Use aggregates to improve query performance
  • Use initialization blocks and variables
  • Create time series measures
Resources
Credits
  • Lead Curriculum Developer: Jim Sarokin

http://www.oracle.com/webfolder/technetwork/tutorials/obe/fmw/bi/bi1113/biadmin11g_01/library/divider.gif
User Comments
Title:
Post as havuphuong1987@yahoo.com Post anonymously
By submitting a comment, you confirm that you have read and agreed to the terms and conditions.
This feedback form is for tutorial corrections and suggestions. Because of the volume of suggestions, we cannot reply to every comment. In particular:
(Comments are moderated and will not appear immediately.)
Oracle Is The Information Company